As you’ve seen, we’re announcing a bunch of new features and improvements in our CMD+CTRL Cyber Range to give you an experience that you’ll remember. Over the past few weeks, we dove into these new features showing you exactly how this latest version can benefit you and your team. Today we finish the series presenting some of the original, powerful training reports included in the CMD+CTRL Cyber Range.
A core function of any training platform is the ability to get a clear picture of everyone’s skill levels. It should highlight areas of strength and weaknesses to give the team a clear path of improving their skills.
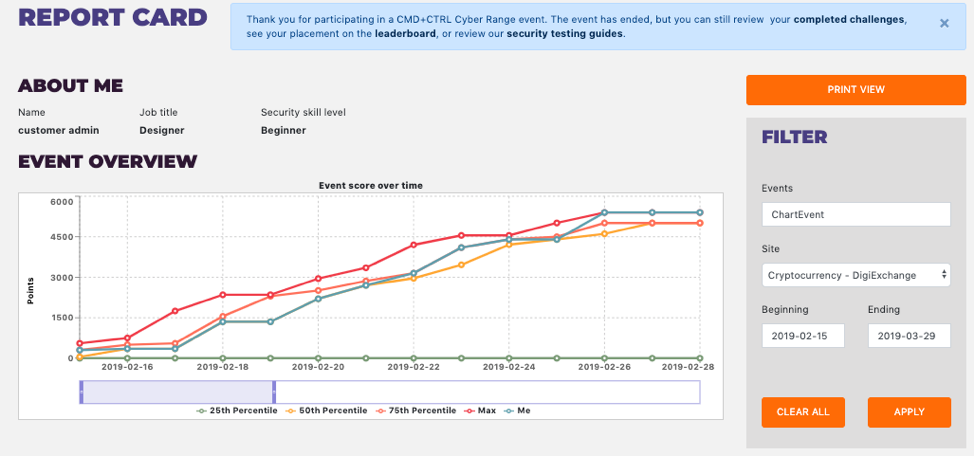
Introducing Report Cards
A concise and powerful feature, the new Report Card shows a player’s results over time. Filter by event, site, and time to get a clear view of how your performance has improved and identify next steps in your learning journey.
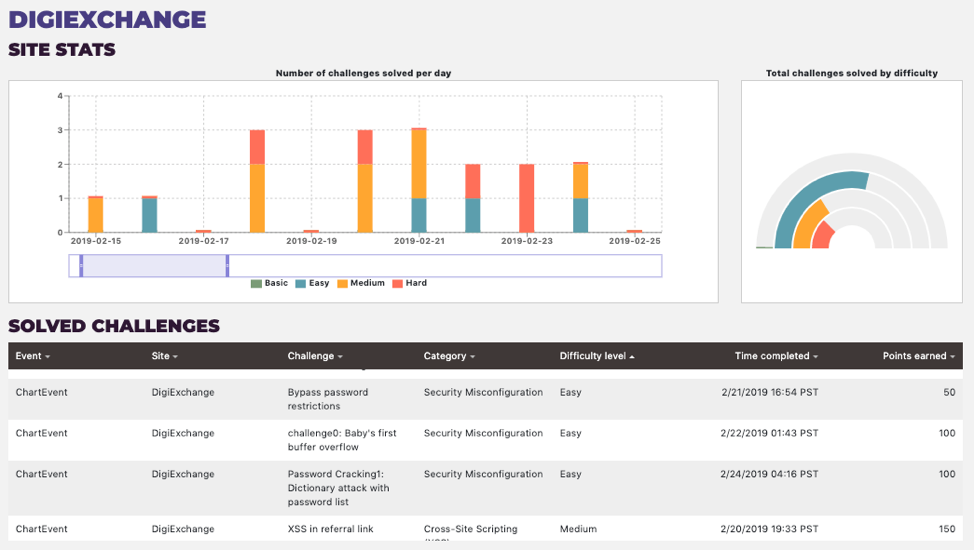
It is also essential to understand how well you’ve done solving challenges with differing difficulty levels – especially the medium to hard challenges. With new dedicated reports that represent a player’s problem-solving skills, it’s now easy to see the progress made in each category and difficulty level over time.
Team Dashboard
In addition to the player report cards, a new Team Dashboard is available for event administrators to track the team’s performance. Drill down to specific events to review the team’s score distribution.
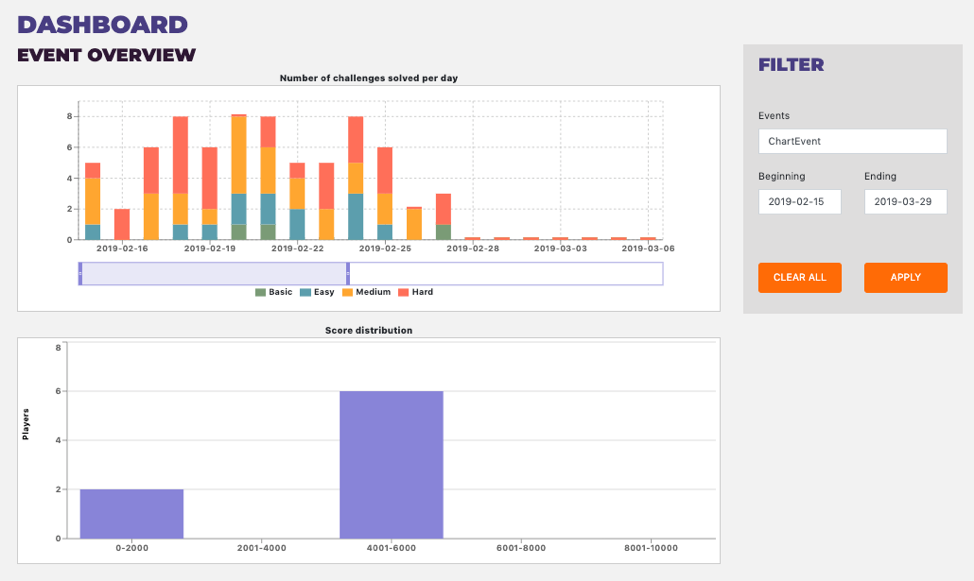
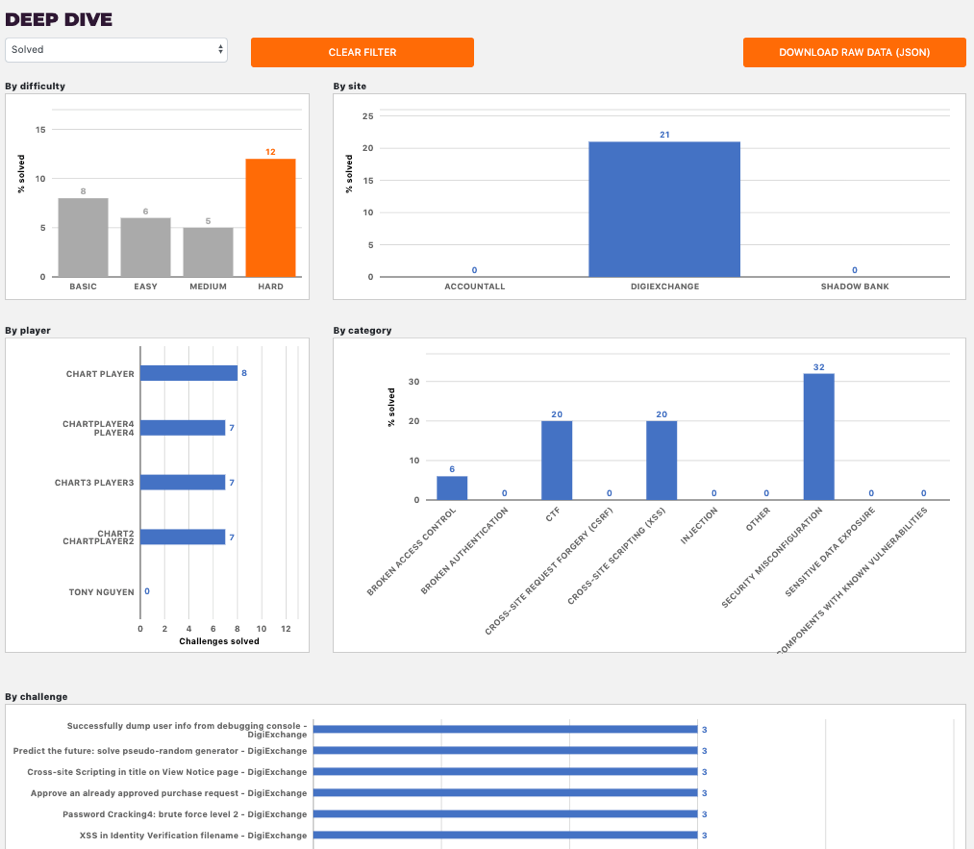
If your management team wants to dive deeper into the results, the five inter-connected Deep Dive charts give a holistic view of the team and individual performances. Adjusting a column on one chart will also update all other charts accordingly, giving you multiple ways to track the progress of your training goals.
Ready to see the whole CMD+CTRL Cyber Range and learn why it’s the most engaging way to improve software security skills? It's easy - simply schedule a free demo.